
How to Analyse Survey Data in 2024 Using WhyHive
So, you’ve run a survey and now you want to analyse your results.
Many survey platforms like SurveyMonkey, Typeform and Google Forms give you a summary of your results at a per-question level, but what you can learn from this type of analysis is limited.
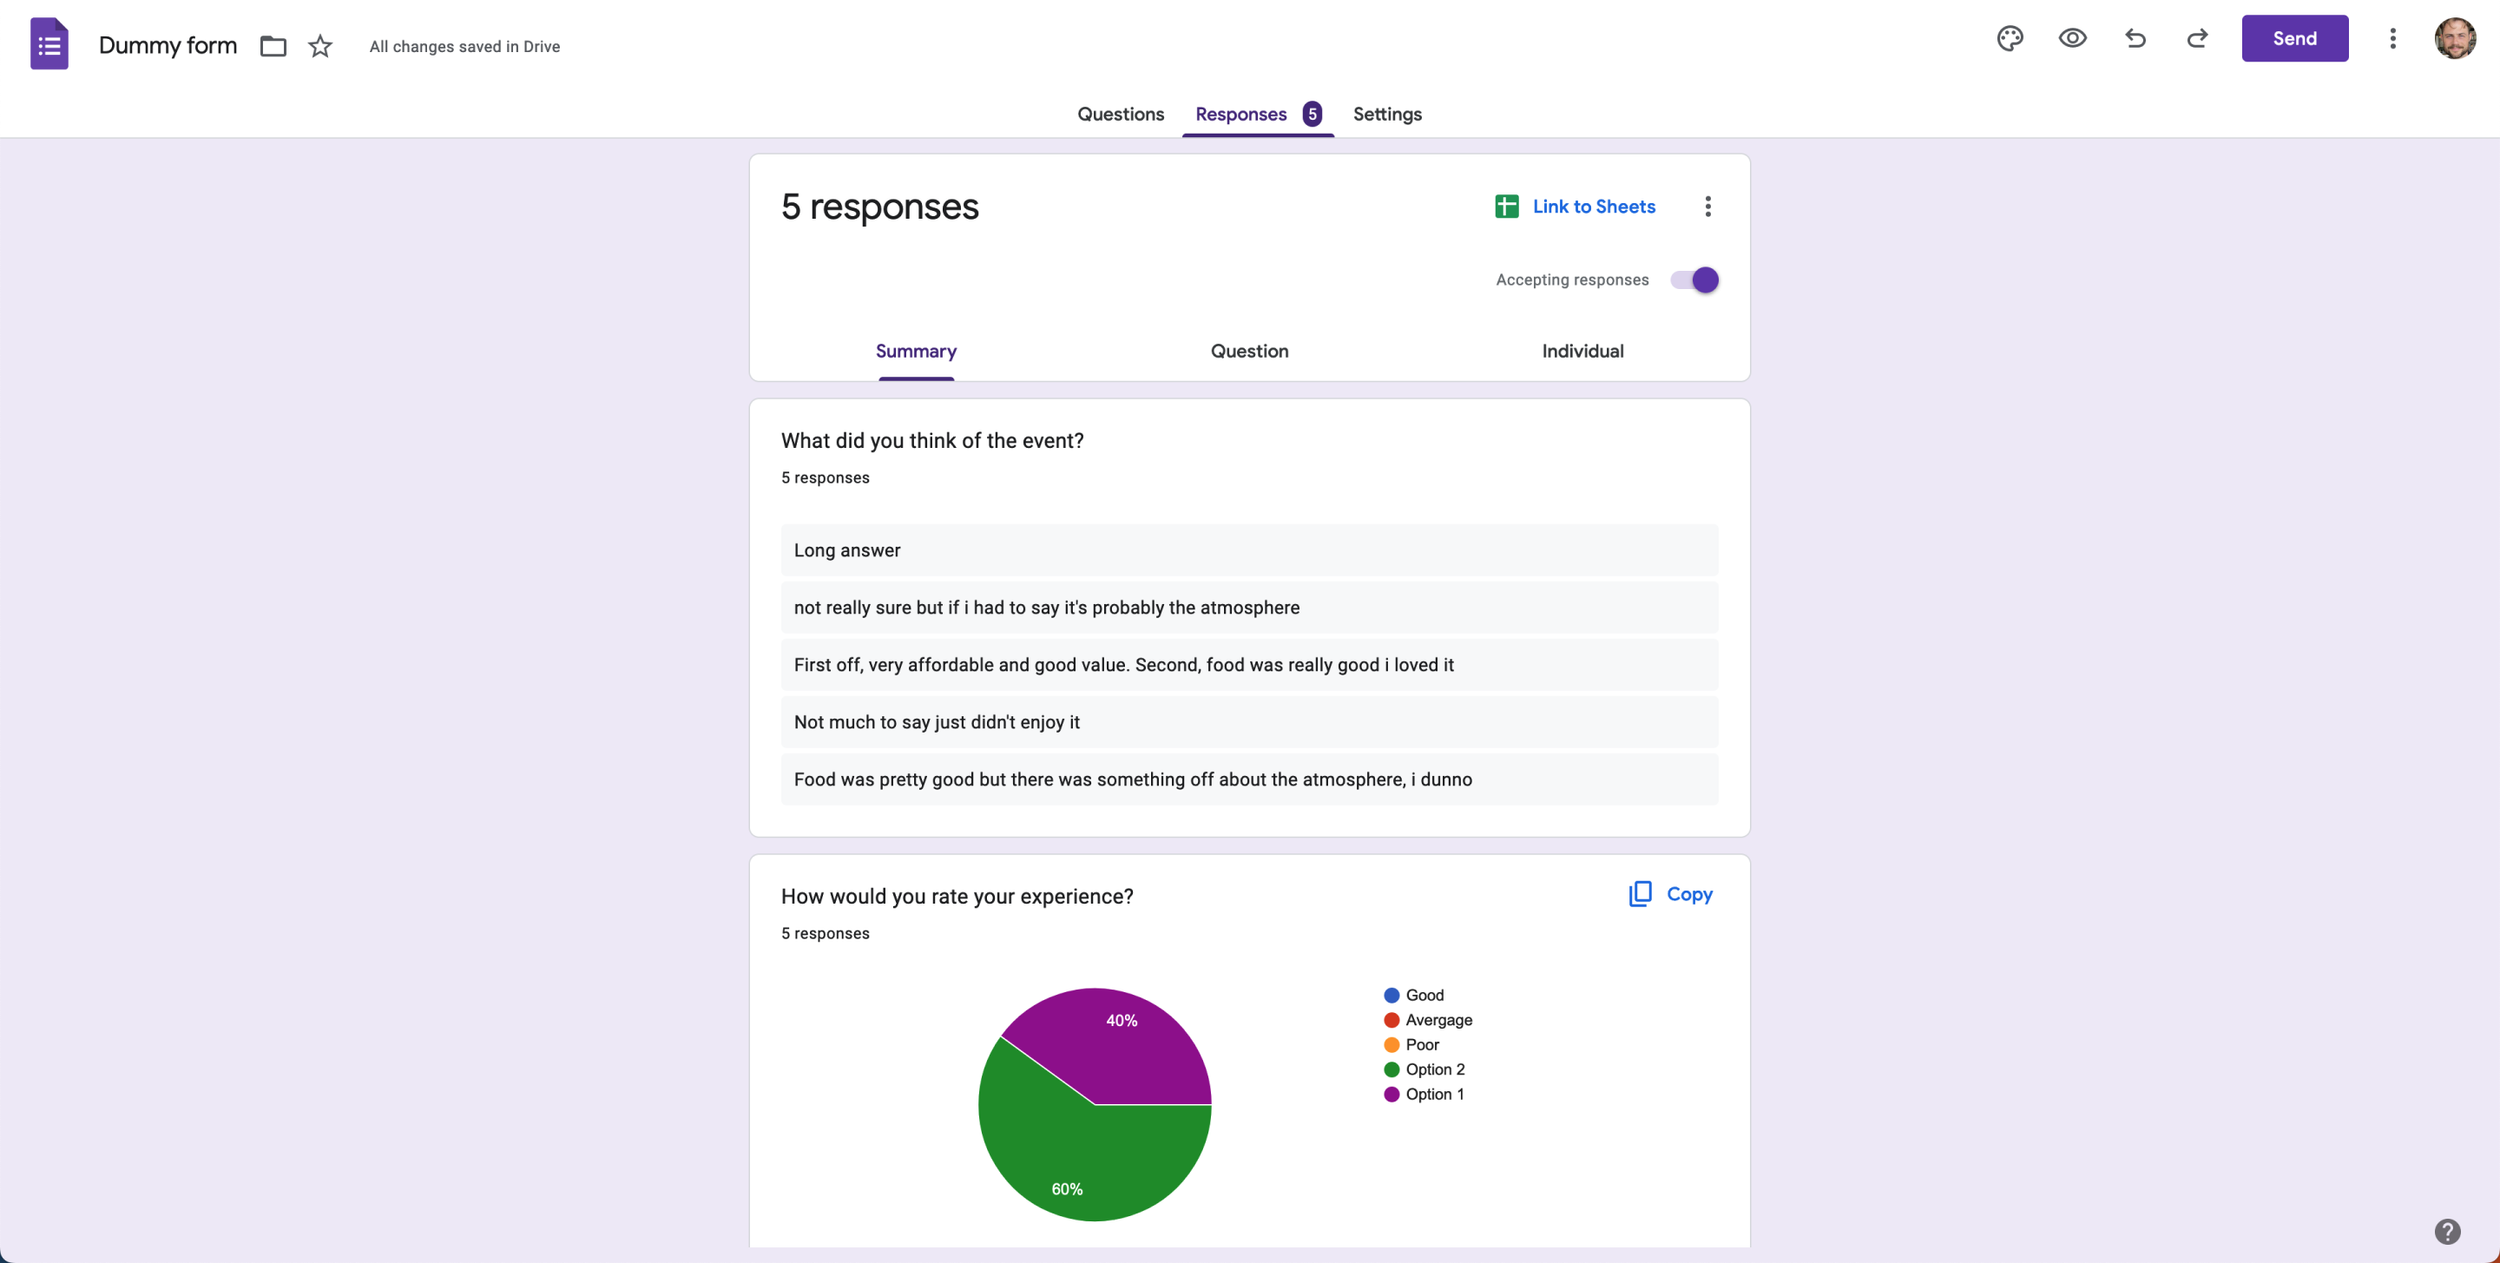
The Responses page on a Google Form. Your insights are limited to a snapshot of each question.
You often can’t choose how to visualise your results, you won’t be able to analyse your text responses, and you can’t compare results from two or more questions against each other to find relationships and correlations.
Fortunately, WhyHive lets you do all of these things.
In this article we’re going to explore how to get more insights out of your survey data using WhyHive.
Step 1: Getting your data into the WhyHive app
Export your data from the survey platform and upload it to WhyHive. Depending on the survey platform, you may need to clean or process your data before uploading it. Our team can help you with this if you’re having trouble.
Step 2: Analysing your close-ended questions
Close-ended questions have a predefined list of choices for a respondent to pick from. This could be multiple choice questions, rating scale questions, yes/no questions, or questions that ask you to pick an option from a drop-down.
For example:
Question:
What age bracket do you fall into?Response options:
Under 19
20-29
30-39
40-49
50+

A star rating question type in SurveyMonkey is an example of a close-ended question.
To see a summary of a close-ended question in the form of a chart, just select the question you want to visualise in the WhyHive app.
For most question types, you’ll have the option to pick from a few chart types when visualising this data.
The results of this analysis will be quite similar to what you can learn from a survey platform’s inbuilt analytics capabilities, but read on to see how we can dive deeper using WhyHive.
Step 3: Analysing your open-ended questions
Open-ended questions allow people to tell you anything that’s on their mind about a certain question. The respondent isn’t restricted to a drop-down list of options.
Open-ended responses can be rich and insightful, but it typically takes a lot of time to read through them to understand trends and extract meaningful insights.
Here’s an example of an open-ended question:
Question:
What did you think of the event?Response 1:
I loved the event. The atmosphere was great and the staff were super friendly.Response 2:
Wasn’t really my cup of tea. Too many peopleResponse 3:
Fun
Typically, when using a survey platform’s in-built analytics capabilities you need to read through each response to understand the patterns. Sometimes researchers will then undertake a process called thematic coding where they classify responses under a set of common themes. From here, they might look through your responses one by one and label instances where a theme is present.
Doing this work on a survey with lots of responses could take hours, days or sometimes weeks of manual effort.
Fortunately, WhyHive uses AI to help you understand the patterns in open-ended responses in minutes.
To do this, head to the Data tab in the app. Click on the Analyse button above the text column you want to analyse.
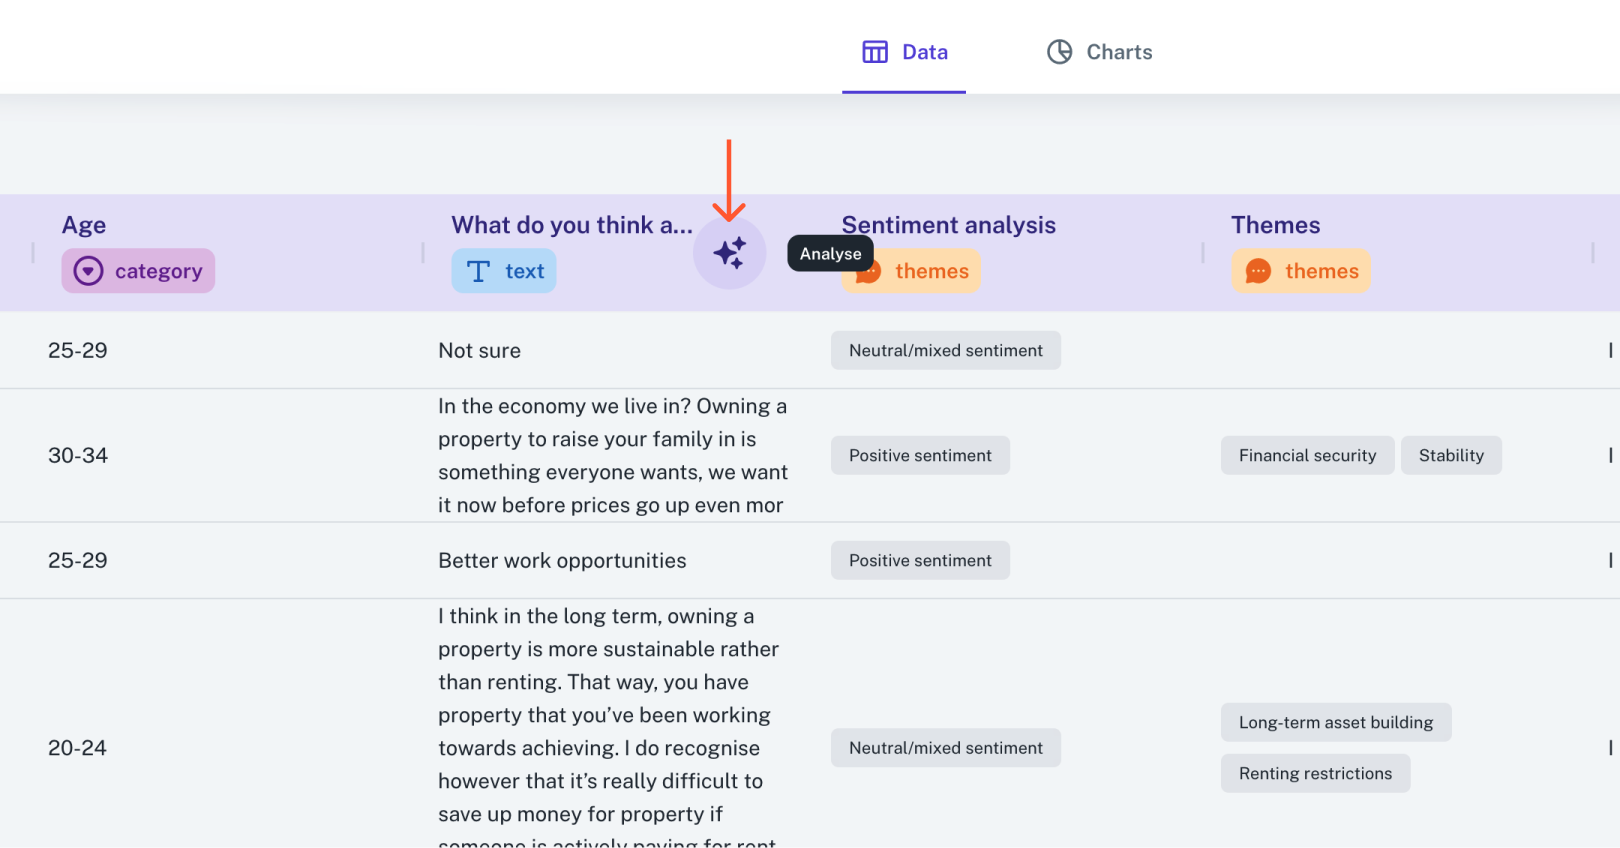
How to analyse text (open-ended) responses in WhyHive.
Here we can use AI to find key themes in the responses for us.
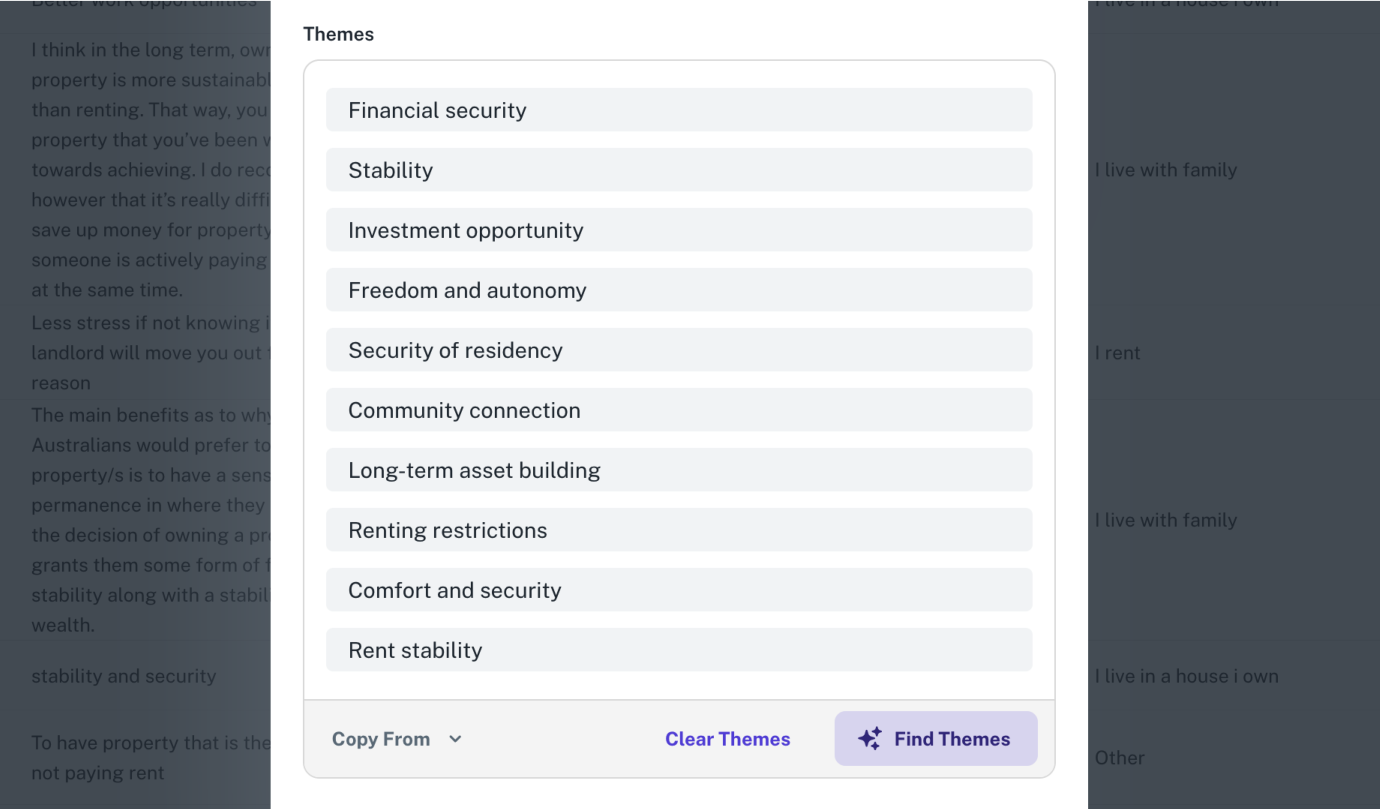
A list of themes generated by AI. These can be modified to suit a user’s preferences.
And then use AI to look at each response and label them with the corresponding themes.

Themes are assigned row-by-row. Now we’ve got something we can analyse more easily!
Once we have our result, we can visualise it with a chart.
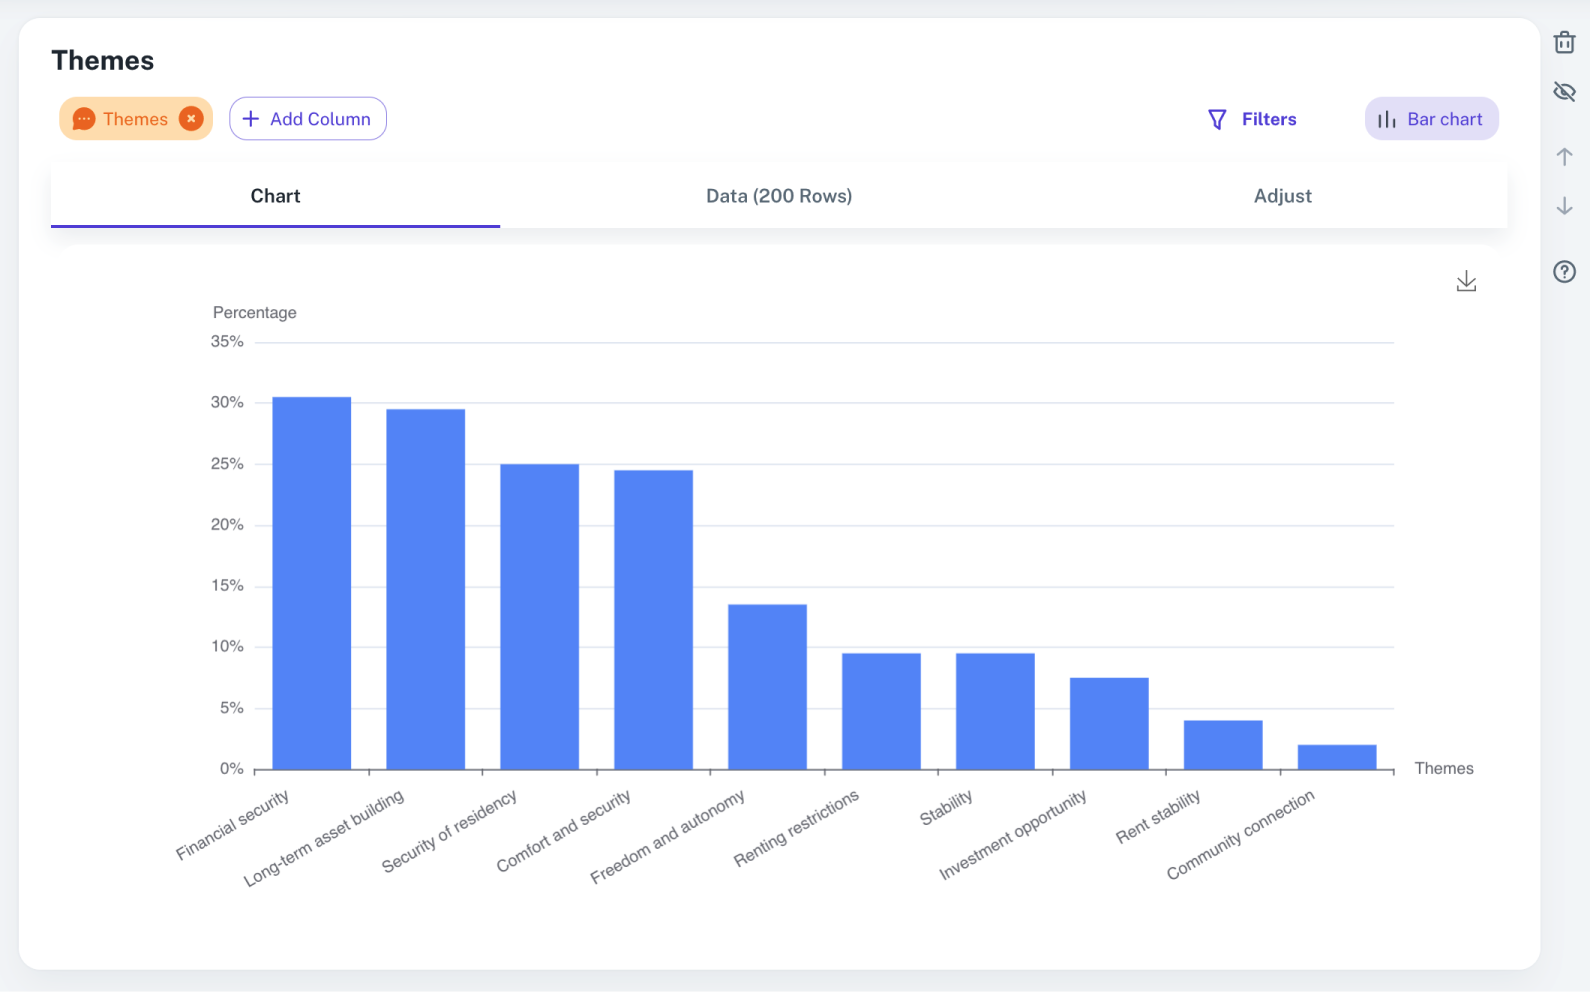
A chart showing the distribution of themes across 200 open-ended text responses.
That’s how you analyse open-ended responses in WhyHive in a fraction of the time.
Step 4: Comparative analysis between multiple questions
Up until this point we’ve only talked about analysing the results of a single question at a time.
However, some of the most interesting insights come from comparing responses across different questions to see which answers in one question relate to answers in another question.
For example, say we wanted to understand the relationship between the Age and State (location) of our respondents.
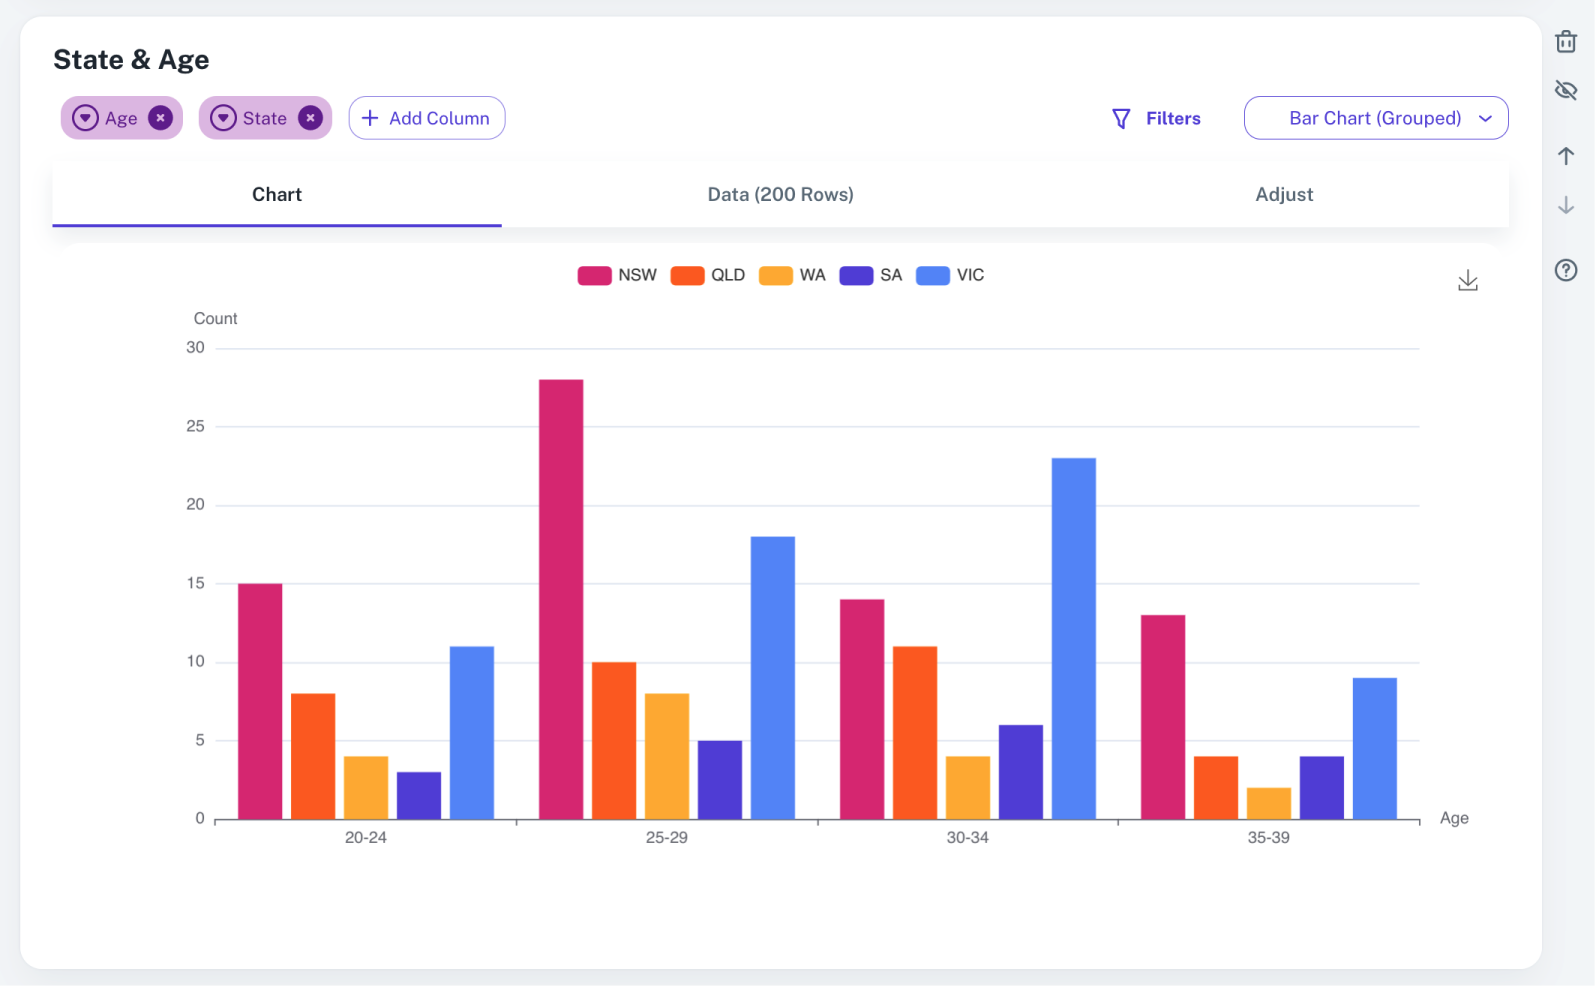
A chart showing the relationship between Age and State (location) in our survey.
By visualising the answers to both questions on the same chart, we can see that a significant portion of respondents from NSW are aged 25-29, and many from VIC are 30-34. These are particularly interesting insights that we would not have discovered if we were limited to visualising only a single question at a time like most survey platforms.
Using WhyHive, we can do this kind of comparative analysis with close-ended and open-ended questions. We just need to make sure that we’ve run the text analysis process described earlier on our open-ended data before we attempt to analyse it.
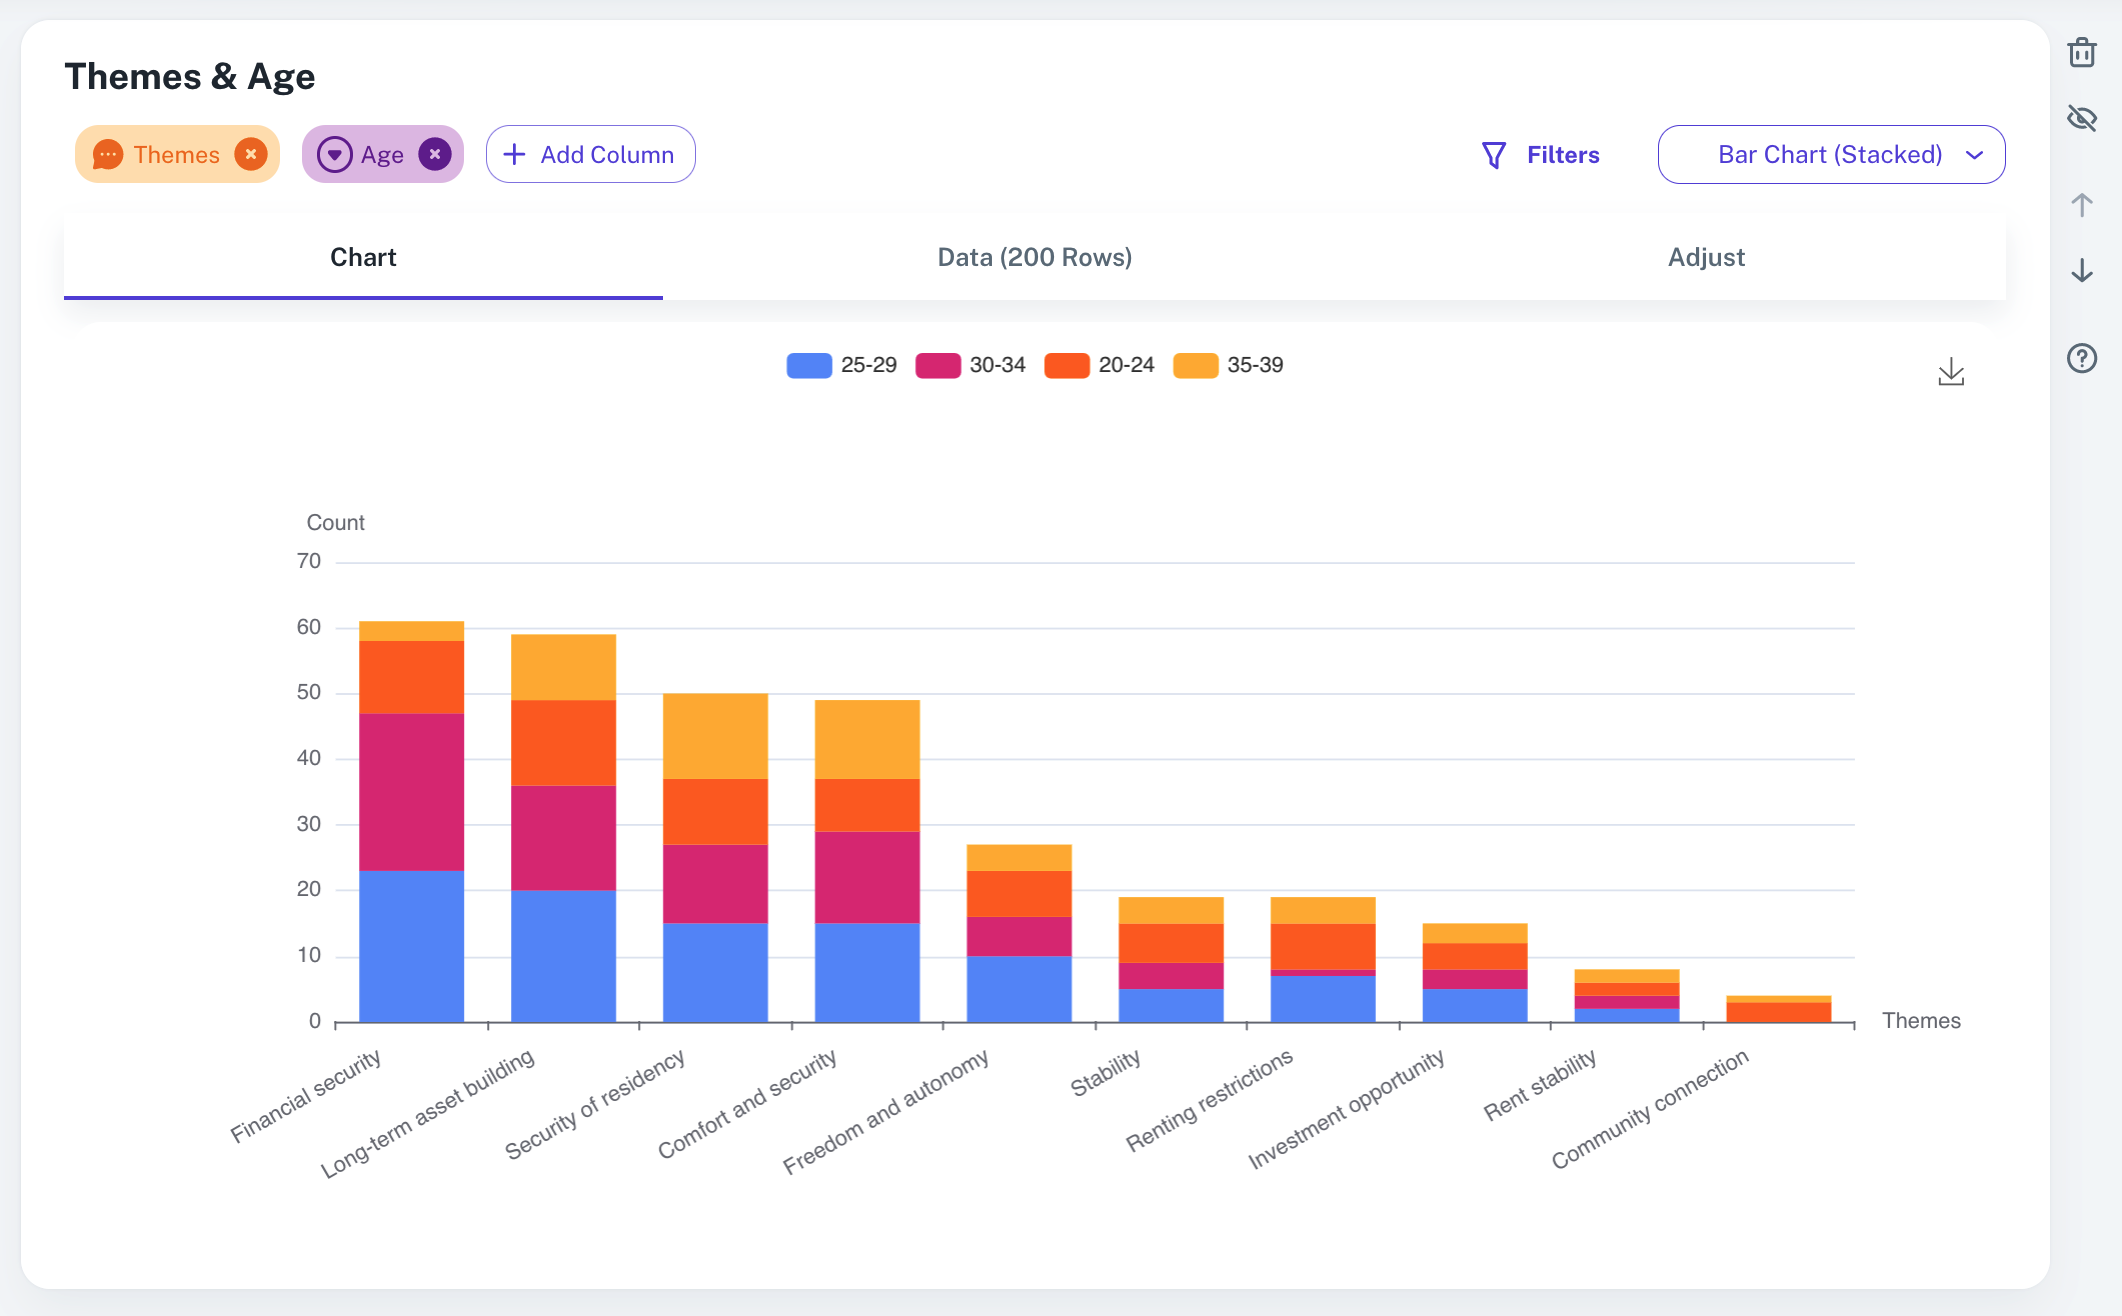
A chart showing the relationship between Themes and Age. The themes were derived from an open-ended column.
Wrapping up, and where to next
If you’re analysing your survey data as part of creating a report, WhyHive has plenty of customisation options to help you create and style the type of analysis that you need.
You can also share an interactive version of your analysis in just a few clicks.
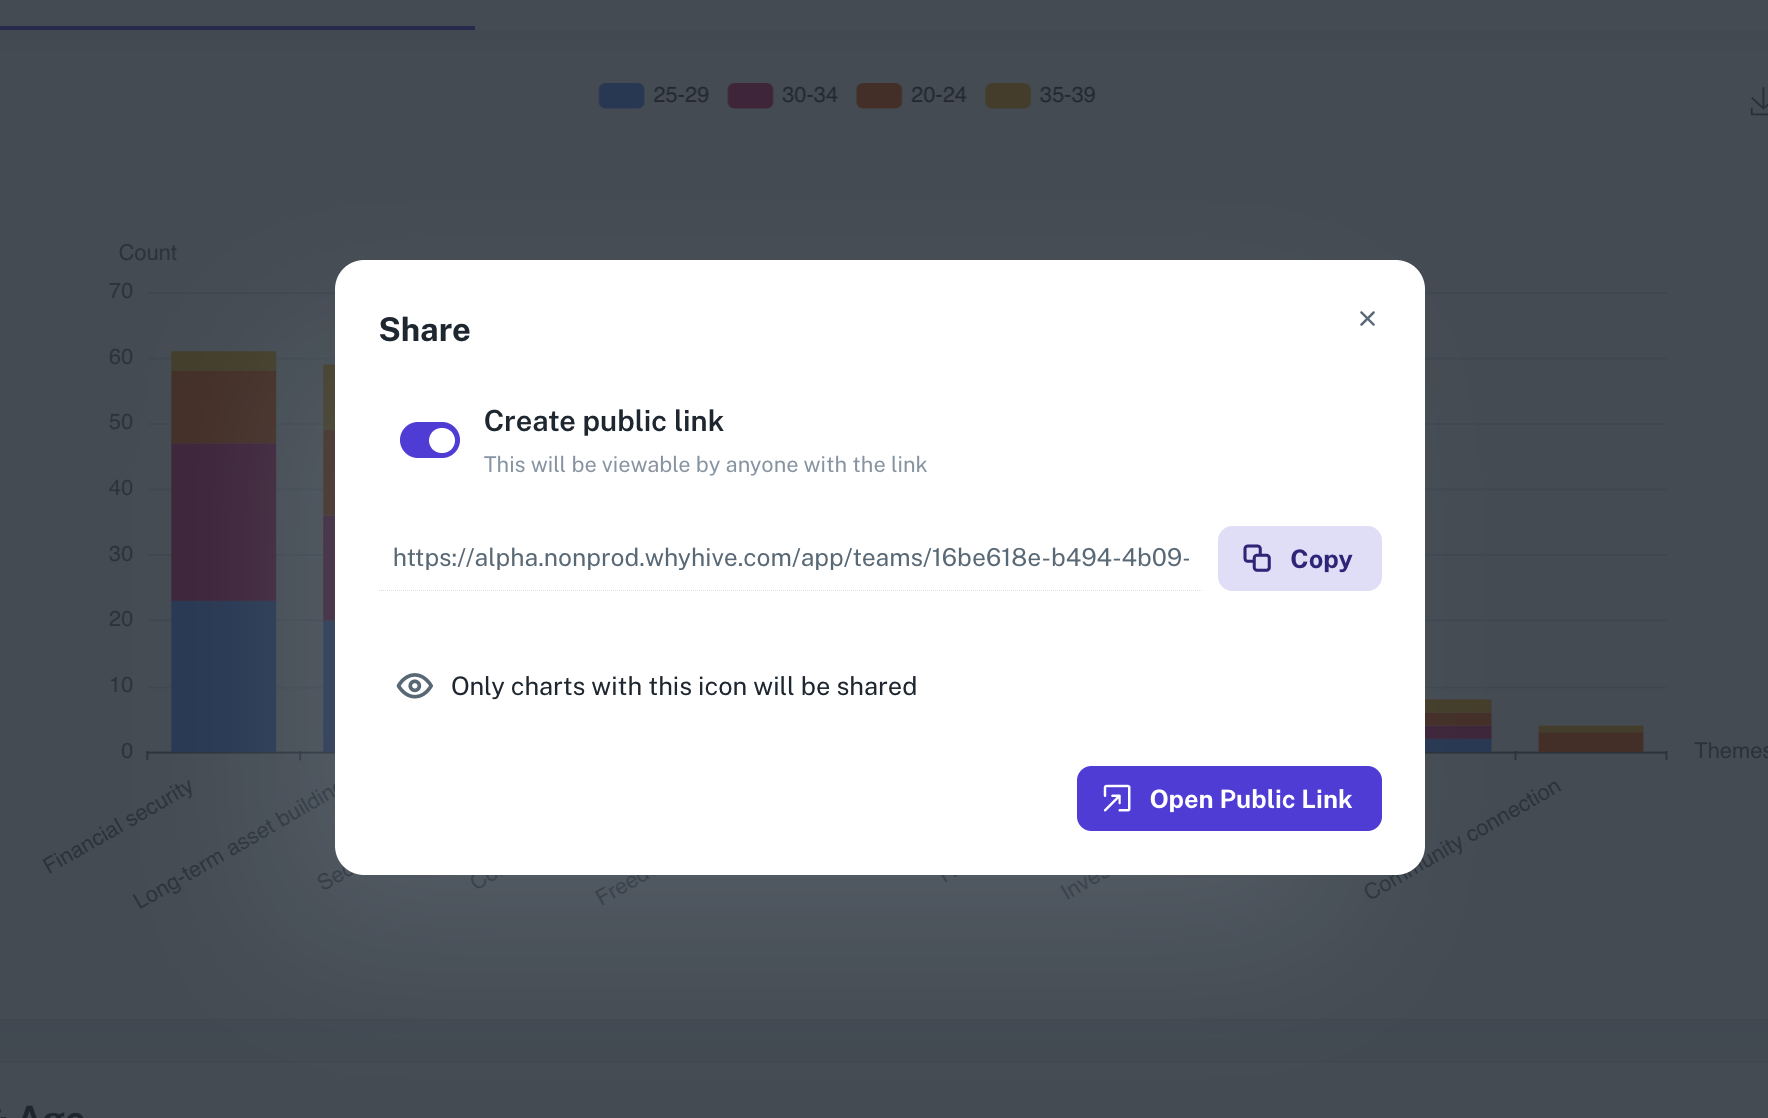
WhyHive lets you share your projects easily.
Alternatively, if you run a lot of text analysis on your open-ended questions and you want to analyse the results in a different platform, you can export your data on the Data tab of the WhyHive app.
And finally, if you have feedback or ideas on how we can make the WhyHive app better, reach out! We’re on a mission to build a simple analysis tool for survey data, and every bit of feedback helps.
You can contact us at info@whyhive.com or message our founding team directly on Linkedin.
Happy exploring!